
CHIEBUKA OKORO
Data Analyst
SQL | Spreadsheets | Power BI | Python
ABOUT ME
I am a Petroleum Engineering graduate who got hooked by the phrase "Data is the new oil". Due to my affinity for oil 😊, I have been exploring this new oil since 2019 before finally getting the opportunity to explore it in a professional setting in 2022 with Snapnet Limited.Helping businesses and individuals make informed decisions using data is what I enjoy doing and the fact that with each project, I keep learning about a variety of industries and how they operate is pure gold.😉When I am not working, I either research in line with my interest(s), take courses, engage in thought-provoking conversations, spend time with family, or watch football.Feel free to reach out to me via Email, LinkedIn, or Twitter. In the meantime, enjoy taking a look at some of my works.
PROJECTS
SQLINT'L BREWERY
Analysis of profit performance, territory comparisons, highest-profit year, least profitable month, and assessing profit percentages to drive strategic decision-making and maximize profitability.

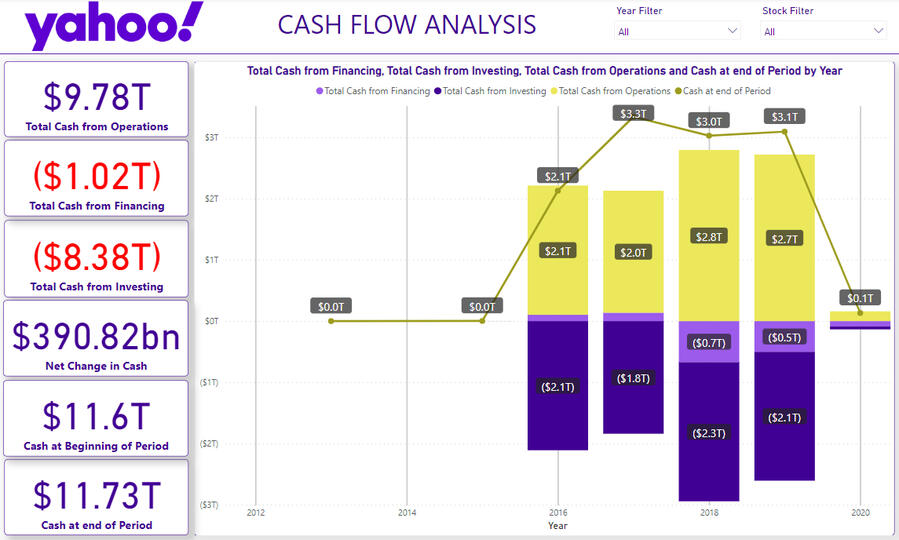
POWER BIFINANCIAL PERFORMANCE ANALYSIS
Develop a report to track the financial performance of 4400+ publicly traded companies with data scrapped from Yahoo Finance
PythonINVESTIGATE A DATASET
Data wrangling and exploratory analysis of the TMDB Movies dataset to uncover trends and valuable insights.

CERTIFICATIONS
This is a growing list of professional certifications I have acquired. To verify any, simply click on the badge.


SQL | INTERNATIONAL BREWERY

CASE STUDY
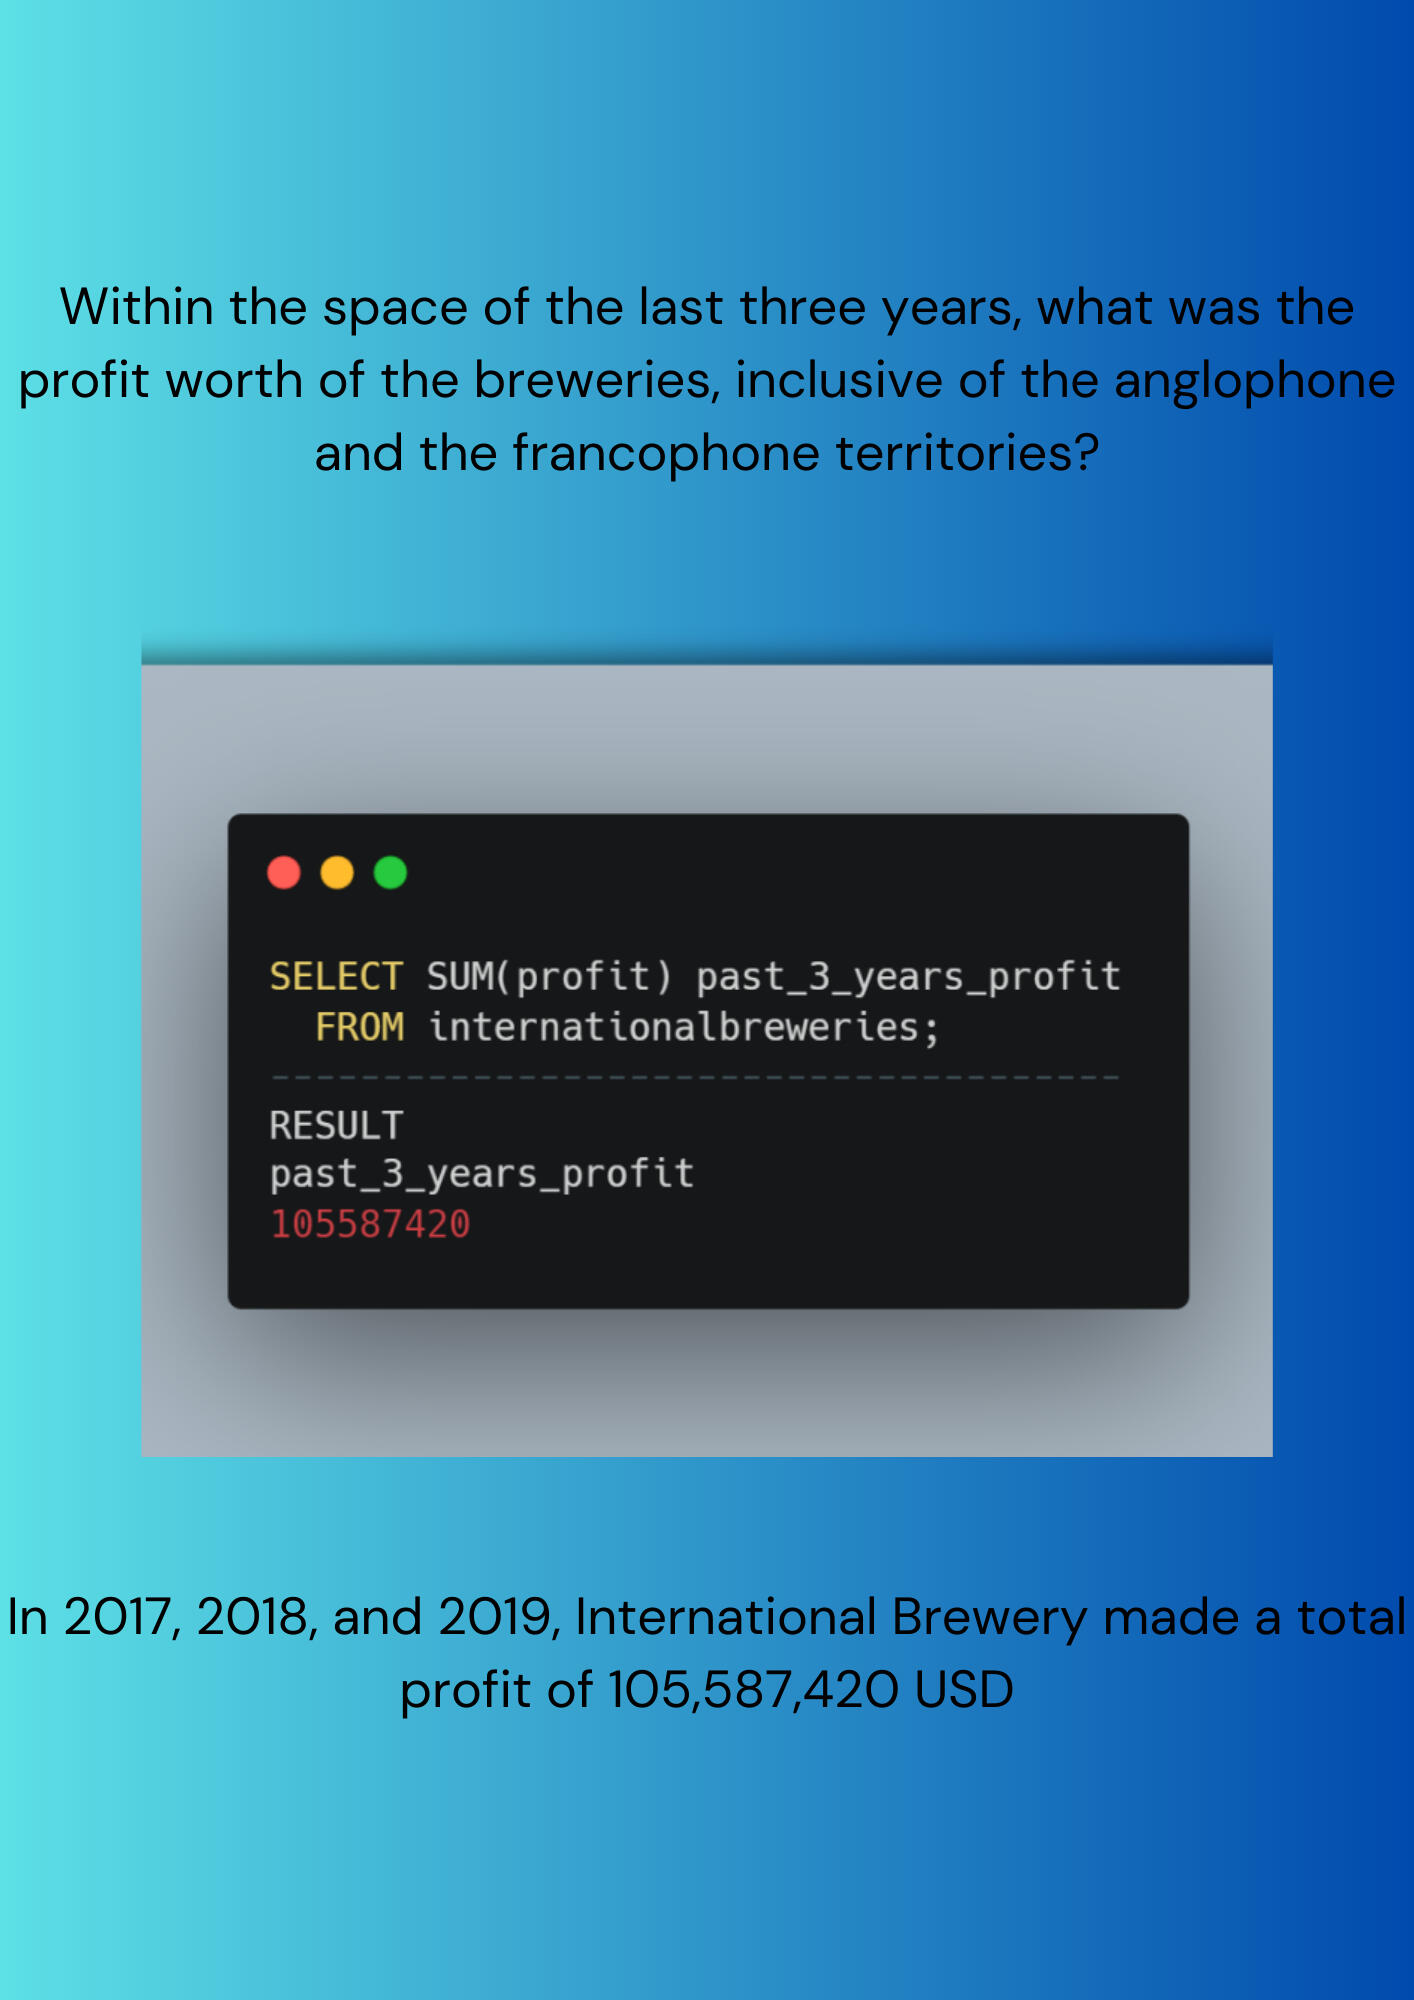
International Breweries is a leading brewery company operating in both anglophone and francophone African territories. In this concise case study, I will analyze the company's profit performance, compare profits between territories, identify the highest profit year, determine the least profitable month, and assess profit percentages for each month in 2019. The insights derived from this analysis will help Mr. Stone, the territory manager, make strategic decisions to maximize profit and improve the overall business.
Profit Performance
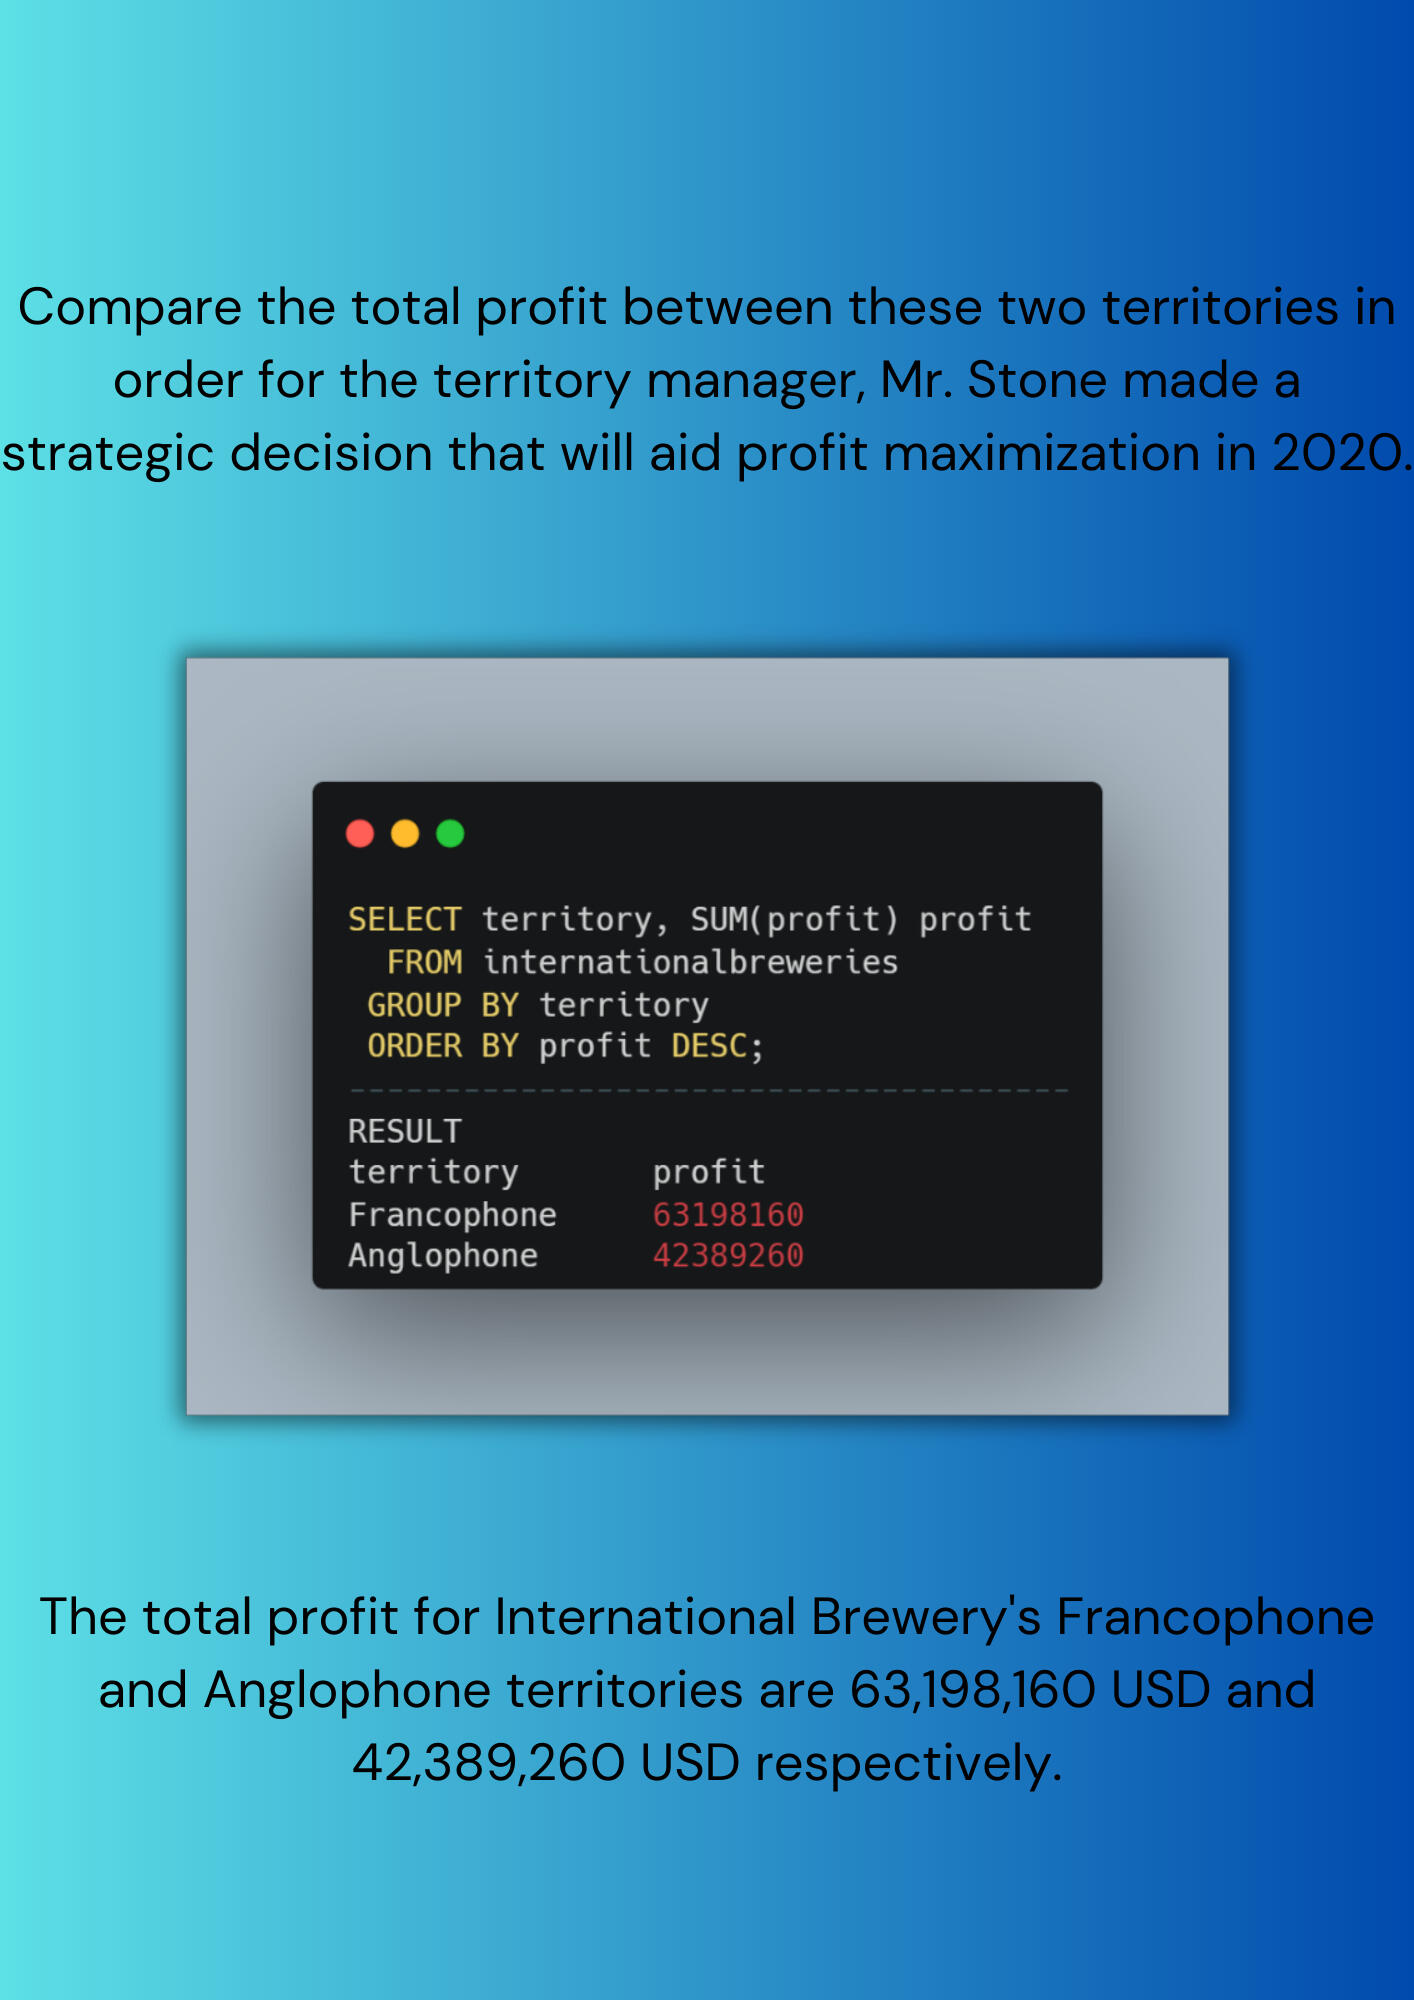
Territory Comparison and Strategic Decision
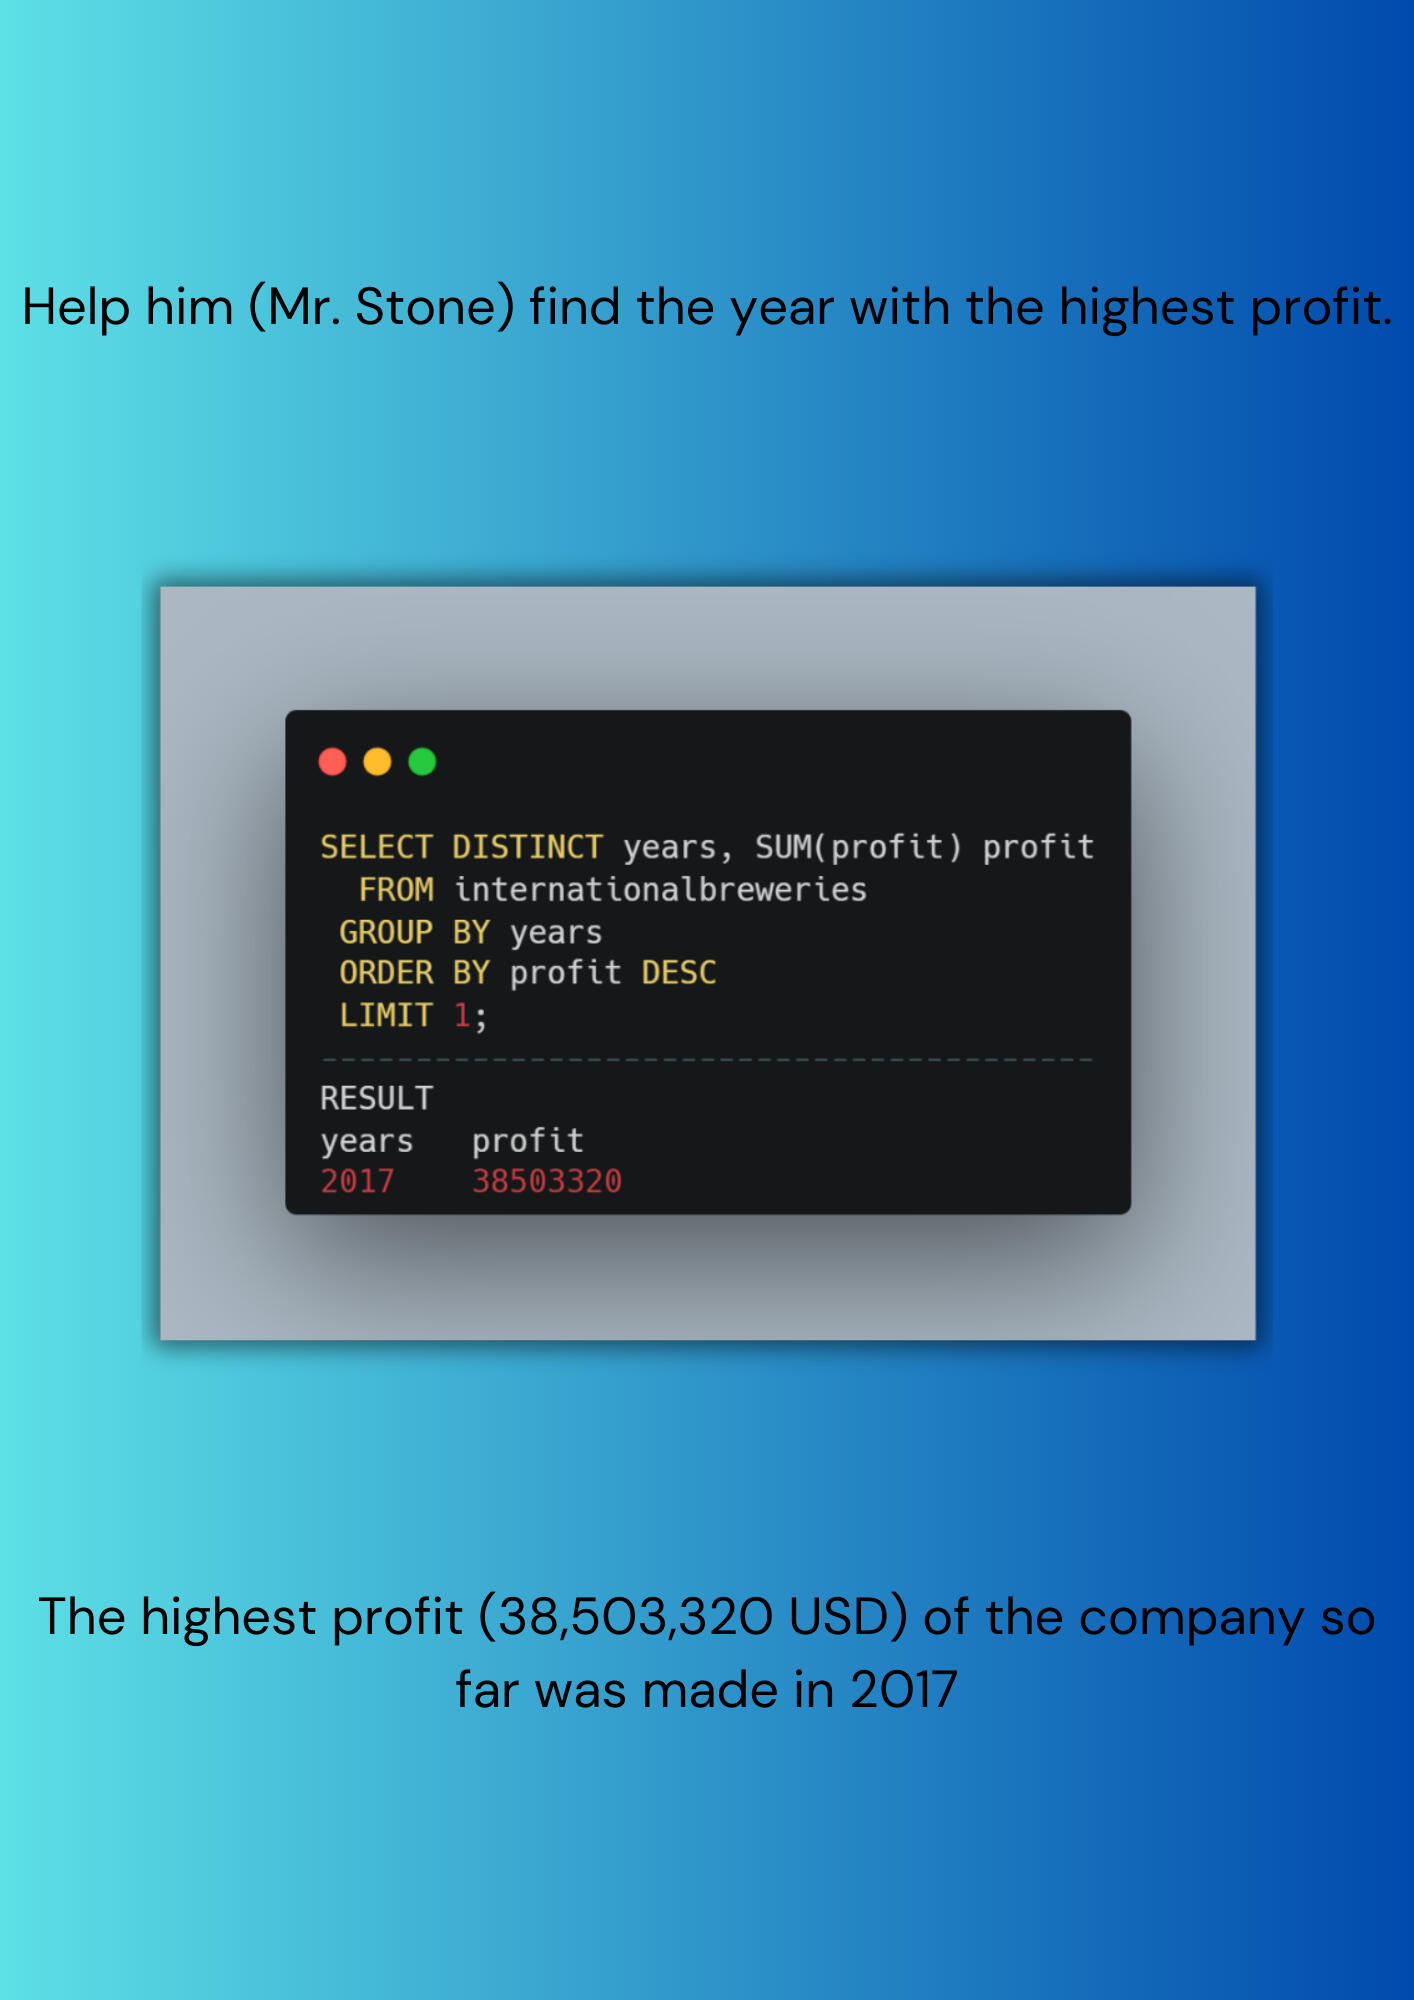
Identifying the Year with Highest Profit
Determining the Least Profitable Month

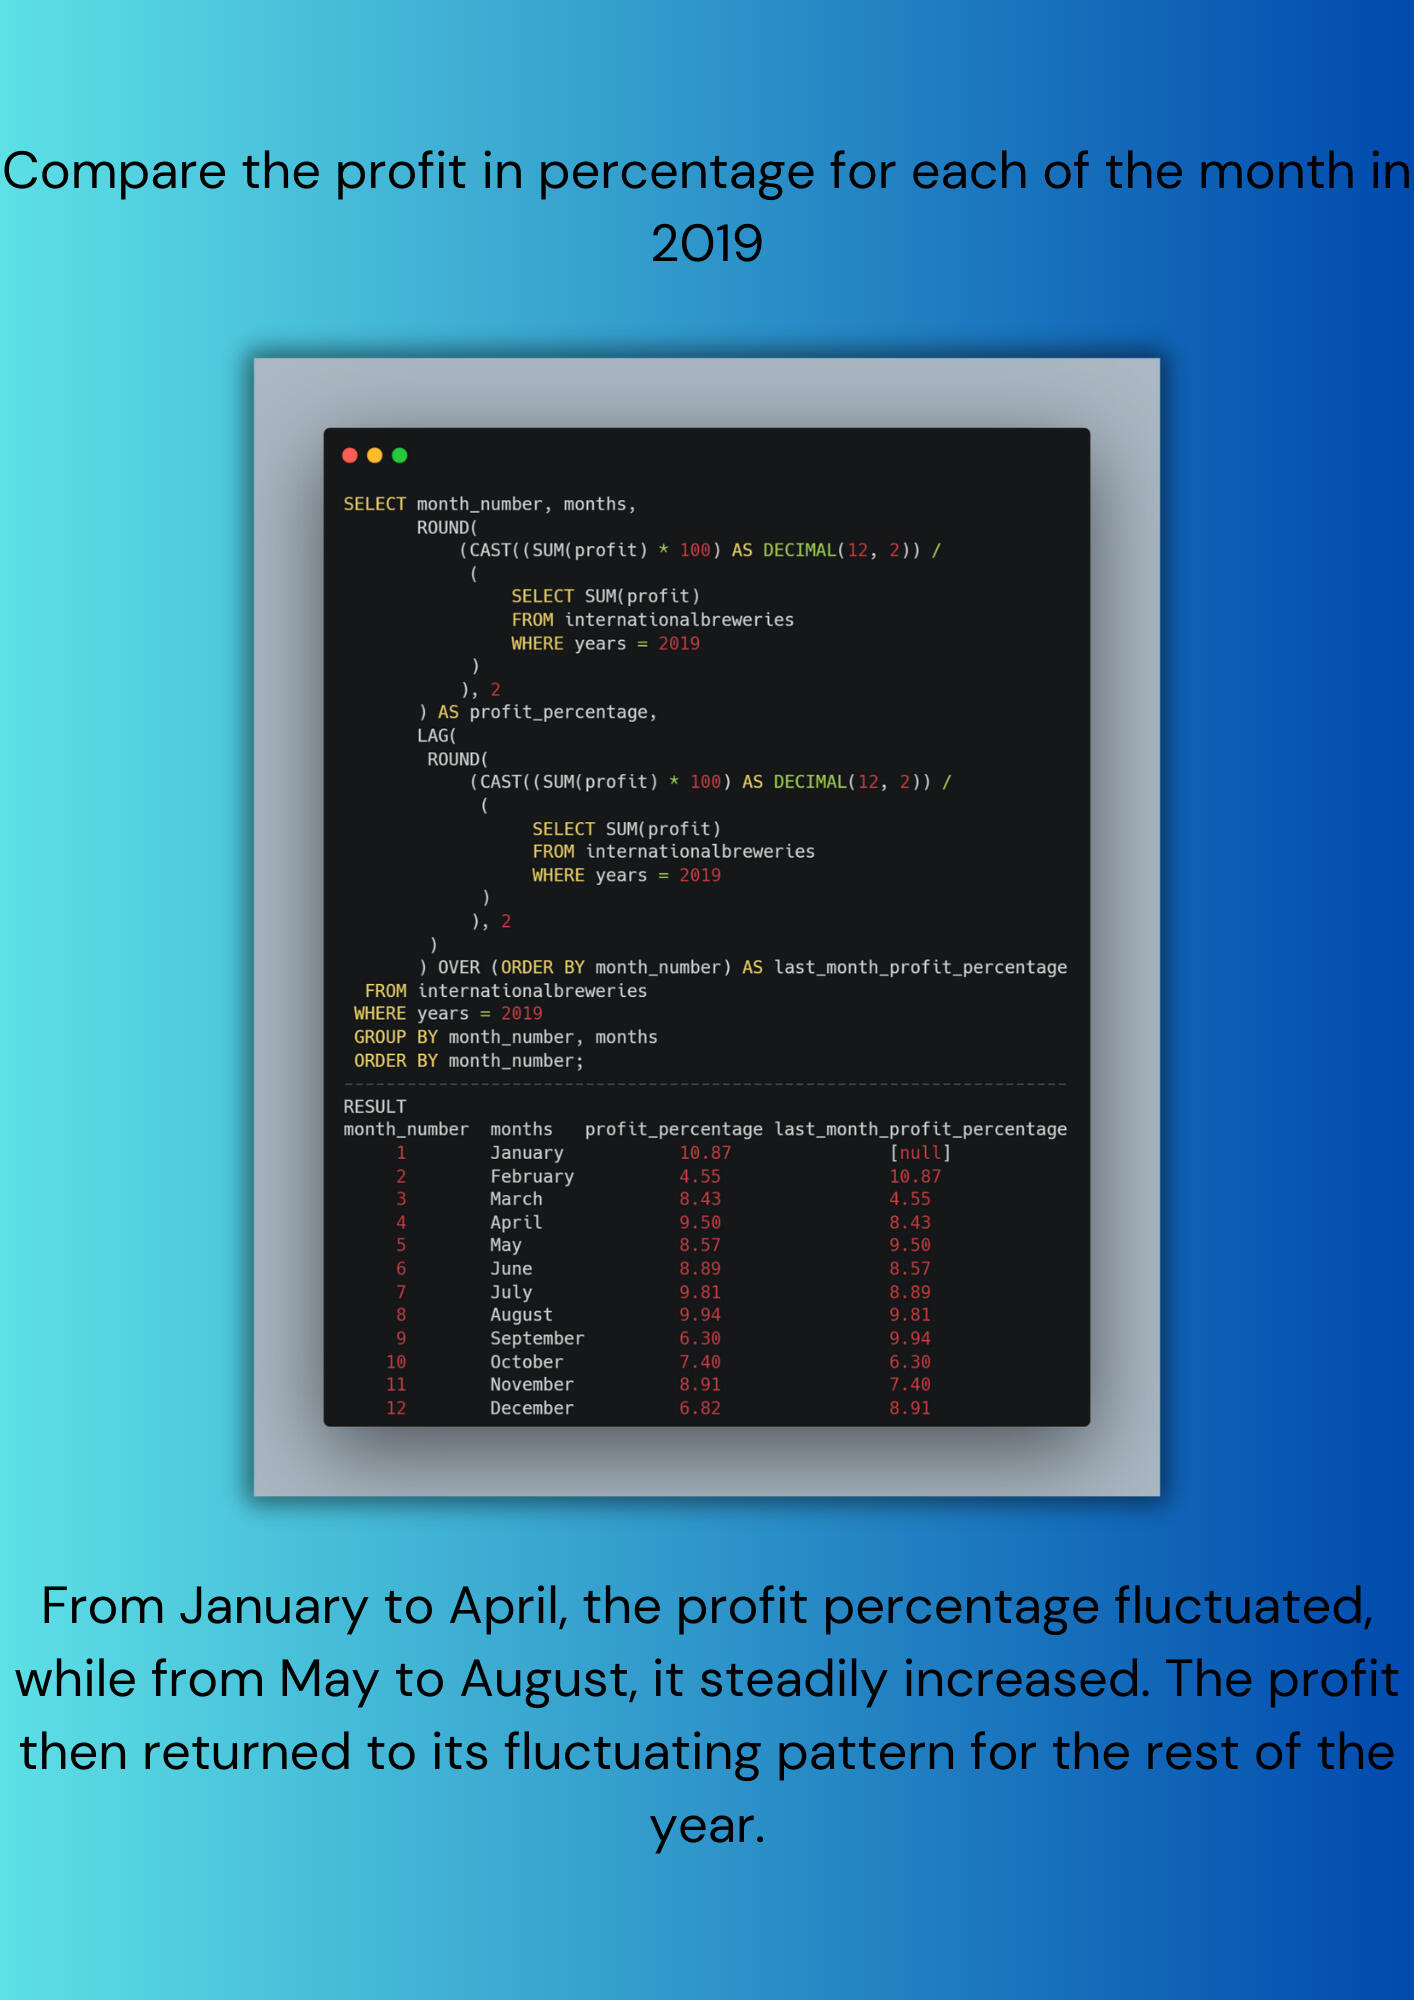
Profit Percentage Analysis for Each Month in 2019
CONCLUSION
The findings above will aid in formulating strategies to maximize profits, improve overall business performance, and position the company for sustainable growth in the competitive brewing industry.NOTE: This analysis was done utilizing PostgreSQL. The script snippet was done using Carbon while the final image was made on Canva
POWER BI | FINANCIAL PERFORMANCE ANALYSIS
REPORT DEVELOPMENT
The aim was to develop reports to help track the financial performance of these companies. After consulting some financial professionals for data and KPI understanding, we agreed that 3 reports should be developed. The reports are:
1. Cashflow Analysis Report
2. Income Statement Analysis Report
3. Balance Sheet Analysis ReportDATA GATHERING AND CLEANING
- The data sets were gotten from Kaggle in CSV format
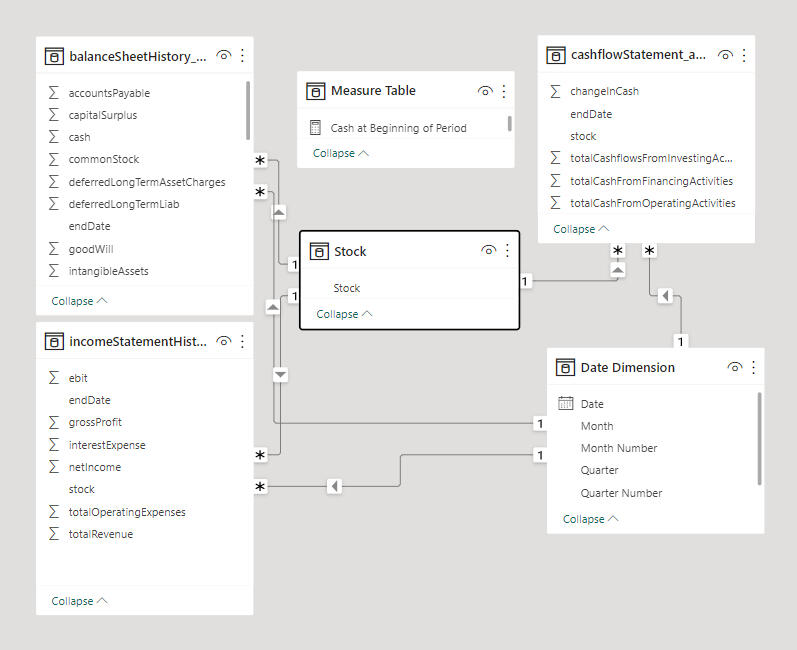
- The data set was accessed and cleaned in Power Query by removing unimportant columns, changing data type, and manipulating other tables to create a stock dimension table.BUILDING THE REPORT
- The cleaned data set was then imported into Power BI.
- I went ahead to create a Date Dimension table and measures using Data Analysis eXpression (DAX).
- Relationships between the tables were then properly created to enable interaction between visuals.
- The right visuals were picked and properly placed on the canvas with slicers to enable filtering.INSIGHT
Overall, the Total Revenue, Total Gross Profit, and Total Net Income increased from 2015 up until after 2019 when they all began to decline. This I feel was a result of the effect of the COVID-19 Pandemic.
REPORT DEMO
NOTE: This report was built using Power BI Desktop and then published to Power BI Service via novyPro tenant. Feel free to interact with the report here
PYTHON | THE MOVIE DATABASE

INTRODUCTION
The data set contains information about 10,866 movies collected from The Movie Database (TMDb), including user ratings and revenue. Certain columns, like ‘cast’ and ‘genres’, contain multiple values separated by pipe (|) characters. The final two columns ending with “_adj” show the budget and revenue of the associated movie in terms of 2010 dollars, accounting for inflation over time.The aim of this investigation is to answer the following descriptive analytics question:1. What year was the highest revenue generated?
2. Which genre of movie has been dominant over the years?
3. Which of the most produced genre generated the highest revenue?
4. What category of movie based on recommendation was the highest?
5. What genre of movie has the lowest average runtime?The investigation was carried out in two steps, which are:
1. Data Wrangling
2. Exploratory Data Analysis (EDA)
Data Wrangling
The data wrangling process was conducted in the following steps:1. The data was imported in CSV format and loaded into a pandas dataframe.
2. Irrelevant columns that did not contribute to the investigation's objective were dropped.
3. Duplicate data was removed from the dataset.
4. Zero values in the budget, revenue, and runtime columns were changed to "nan" to ensure accurate statistical analysis.
5. The genre column was split into main genre and subgenres. The genre and subgenre columns were then dropped, retaining only the main genre column for exploratory data analysis.
6. A recommendation column was added based on the average rating to categorize movies for recommendation purposes.
As a result of these steps, the dataset size was reduced to 10,865 rows and 12 columns, compared to the initial dataset that had 10,866 rows and 21 columns.
Exploratory Data Analysis
This step answers the questions posed by the investigation. Below are the answers.1. What year was the highest revenue generated?
Answer: 2015
2. Which genre of movie has been dominant over the years?
Answer: Drama with Comedy and Action coming second and third respectively
3. Which of the most produced genre generated the highest revenue?
Answer: Action Genre
4. What category of movie based on recommendation was the highest?
Answer: Recommended Category
5. What genre of movie has the lowest average runtime?
Answer: Animation Genre
CONCLUSION & LIMITATIONS
CONCLUSION- The revenue generated over the past 55 years has shown a consistent average increase, with the highest revenue recorded in 2015.- Despite ranking third in movie production, the action genre outperformed others by generating the highest overall revenue. Further study is recommended to understand the factors contributing to its success.- To improve recommendations, a study should be conducted to identify strategies for elevating a significant portion of movies from the "Recommended" to the "Highly Recommended" category.- The history genre has a notably high average runtime, prompting a recommendation for a study to explore its potential impact on the genre's comparatively lower revenue generation.LIMITATIONS
- The presence of missing data in the budget and revenue columns restricted the creation of an additional column (revenue - budget), which would have allowed for analysis of the profit trend over the years.- The intended use of a user-defined function in the analysis was not possible due to the aforementioned limitation of missing data.To view the full investigation, click hereNOTE: This investigation was carried out using the following python libraries on Jupyter Notebook: Pandas, Numpy, and Matplotlib.